

FULL DISCLOSURE:
I am not a financial advisor. This post is to provide information and not provide financial product advice. I discuss why I personally chose to invest in a stock, ETF, ETNs, CEF, REIT, investment fund or cryptocurrency (which I have held for over a week) and also share information that is public about the following stock, ETF, ETN, CEF, REIT, investment fund or cryptocurrency and they are based on my own personal opinion.
If I do not have anything invested or if I have sold the stock at the time of blogging the article, I will definitely let readers know.
I will not blog about any positions of stocks, ETFs, ETNs, CEFs or REITS and cryptocurrency which were initiated just within the last 72 hours of posting this blog article.
It is recommended that you should always consider visiting a financial advisor for independent financial advice before making investment decisions.
I do not work in the financial industry, so just because I write about it, doesn’t mean you should own it. So, consult with a financial advisor and do your due diligence, RESEARCH!
The results shown or discussed represent past performance; past performance does not guarantee future results. Current performance may be lower or higher than the past performance shown, which does not guarantee future results. Share price, principal value, and return will vary, and you may have a gain or a loss when you sell your shares.
I am not receiving compensation by the company for this blog post.
I have no working relationship with any company whose stock, ETF, ETN, CEF, REIT or cryptocurrency mentioned in this blog post. Nor do I have a family member or friend who works with the company.
When it comes to investing, I have to say that Portfolio Visualizer has been an online software that has changed my approach on how Invest.
Portfolio Visualizer is an online software platform for portfolio and investment analytics to help you make informed decisions when comparing and analyzing portfolios and investment products. Our suite of quantitative tools covers portfolio modeling and backtesting, Monte Carlo simulations, portfolio optimization, factor models, and tactical asset allocation models.
Portfolio Visualizer according to the website offers:
- Backtest Portfolio – Backtest a portfolio asset allocation and compare historical and realized returns and risk characteristics against various lazy portfolios.
- Factor Analysis – Run regression analysis using Fama-French and Carhart factor models for individual assets or a portfolio to analyze returns against market, size, value and momentum factors.
- Asset Analytics – Find funds based on asset class, style and risk adjusted performance, and analyze asset correlations.
- Monte Carlo Simulation – Run Monte Carlo simulations for the specified portfolio based on historical or forecasted returns to test long term expected portfolio growth and survival, and the capability to meet financial goals and liabilities.
- Portfolio Optimization – Chart the efficient frontier to explore risk vs. return trade-offs based on historical or forecasted returns. Optimize portfolios based on mean-variance, conditional value-at-risk (CVaR), risk-return ratios, or drawdowns. Apply the Black-Litterman model to find the optimal portfolio based on market views.
- Timing Models – Compare and test market timing models based on moving averages, momentum, the Shiller PE ratio valuation, and target volatility.
So, for Fund Performance Analysis, I was able to look through various ETFs I owned and see how they perform but also visualize the sectors where the ETF is invested. I can check the performance, the exposures, the risk measures, monthly returns and rolling returns.

But my favorite is the Backtest Portfolio Asset Allocation Tool.
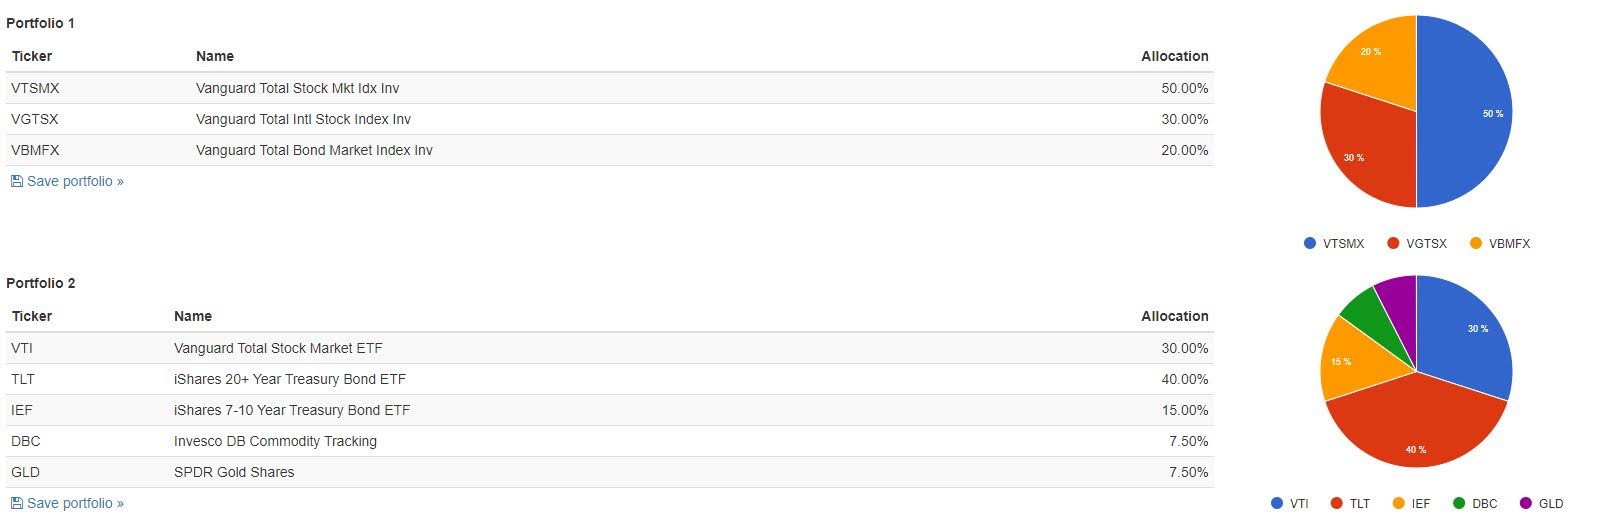
This portfolio backtesting tool allows you to construct one or more portfolios based on the selected mutual funds, ETFs, and stocks. You can analyze and backtest portfolio returns, risk characteristics, style exposures, and drawdowns. The results cover both returns and fund fundamentals based portfolio style analysis along with risk and return decomposition by each portfolio asset. You can compare up to three different portfolios against the selected benchmark, and you can also specify any periodic contribution or withdrawal cashflows and the preferred portfolio rebalancing strategy.
The related asset class level portfolio modeling tool allows you to analyze and compare asset class level portfolios with a longer time horizon starting from 1972.
And for me, I like to see how my portfolio compares to other portfolio’s such as Growth, Moderate, Conservative, Income, Bill Bernstein No Brainer, Billl Schultheis Coffee House, Bogleheads Three Fund, Bogleheads Four Fund, David Swensen Lazy Portfolio, David Swensen Yale Endowment, Ray Dalio All Seasons, Rick Ferri Core Four, Larry Swedroe Simple Portfolio, Scott Burns Couch Portfolio, Stock/Bonds 60/40 and more.

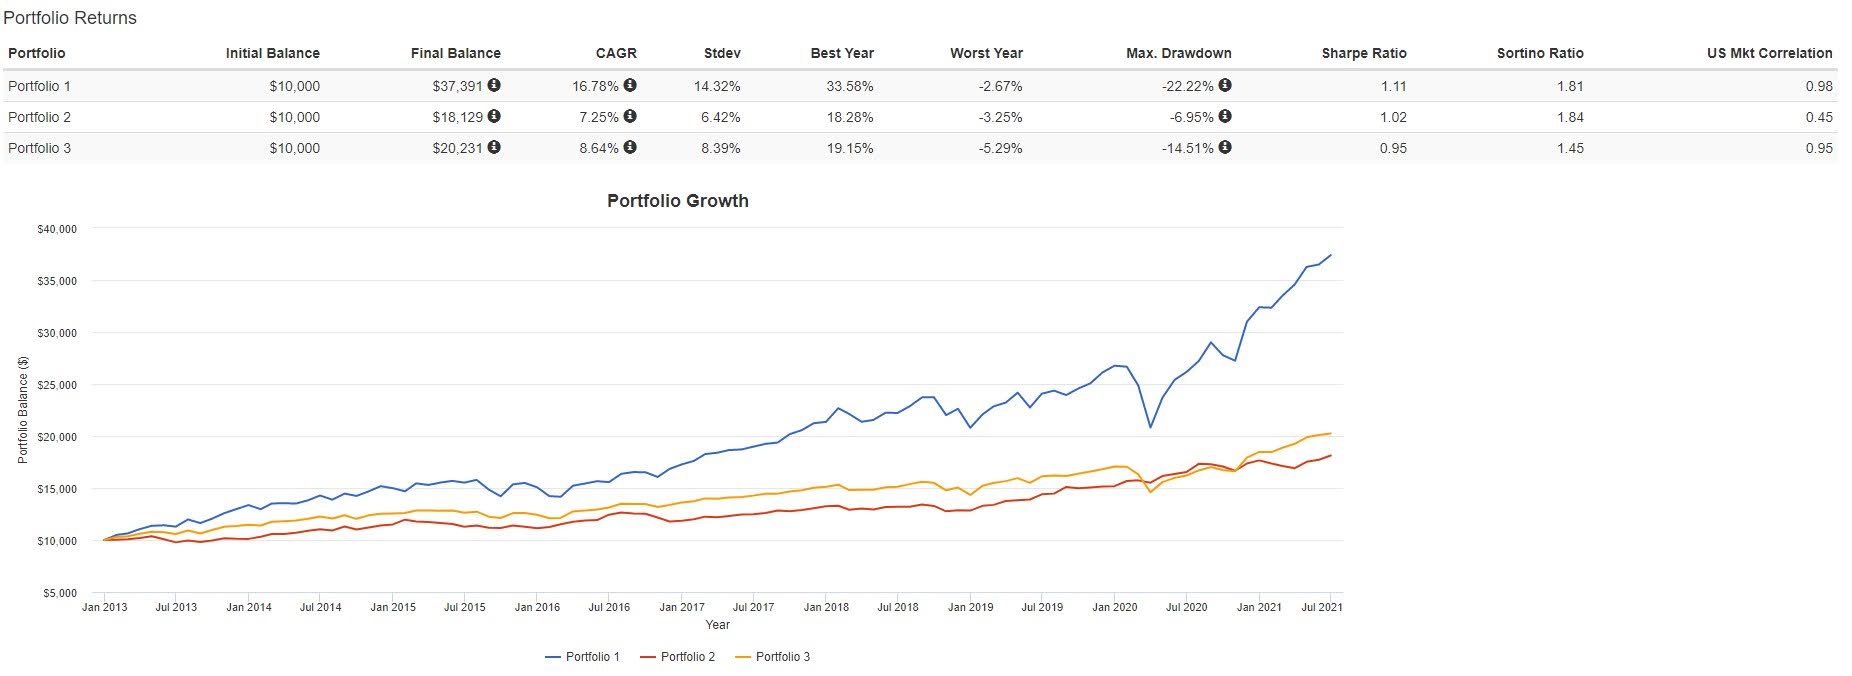

So, I’m constantly looking at my portfolio’s, backtesting and also experimenting of what if I went all S&P 500 index and bonds. What if I did 80/20 vs. 60/40 and how would the performance be? What if I compared my portfolio to a Ray Dallio All Weather and other portfolios. Would their be growth, how would the returns look like, what is the max drawdown?
Of course, past performance is no guarantee of future results, which may vary.
But sometimes, we need that visual to understand how our portfolio looks. I have one portfolio focused on the Total World Market, I have another which is my portfolio that feature sector-based stocks, another that focuses on S&P 500 and International. And I have another that focuses on dividends.
It’s important to know how your portfolio would have done through the years, especially during a market crash and you can visualize and see for yourself, can you stomach these crashes? Or you set your portfolio for growth, how will it perform? What if I add bonds to this portfolio? What if I just focus on a total international stock index without the international and bonds?
So, it’s good to utilize Portfolio Visualizer for a multitude of things, especially when it comes to help you visualize your portfolio and compare it with other portfolios of successful individuals or planned or existing portfolios that you have. I definitely recommend it!